

Updated: Apr 9, 2024
Welcome to Spend Analysis 101, the best spend analysis guide since 2019!
This guide is intended as an introduction to the topic, but we don't stop there.
As you read on, you'll see how to conduct spend analysis, types of reports, and how to choose a software solution.
Spend analysis is the practice of analyzing procurement spend to decrease costs, increase efficiency, or improve supplier relationships.
With spend analysis, you identify and extract valuable information that gives you strategic insights.
It’s one of the key methods procurement organizations use to proactively identify savings opportunities, manage risks, and optimize their organization’s buying power.
That's why we wrote this guide: spend analysis is the foundation of a good procurement strategy.
This guide is for people of all skill levels who want a refresher on the most important aspects of analyzing procurement spend.
So, let's get started!
The basics of spend analysis
Spend analysis begins with the collecting and cleansing of data. After that, you can classify and consolidate the data so it’s grouped and named in understandable ways.
Next, the data can be merged with external data and be ready for the analysis stage.
The insights from spend analysis can improve visibility into corporate spend, as well as drive performance improvement, contract compliance, and cost savings.
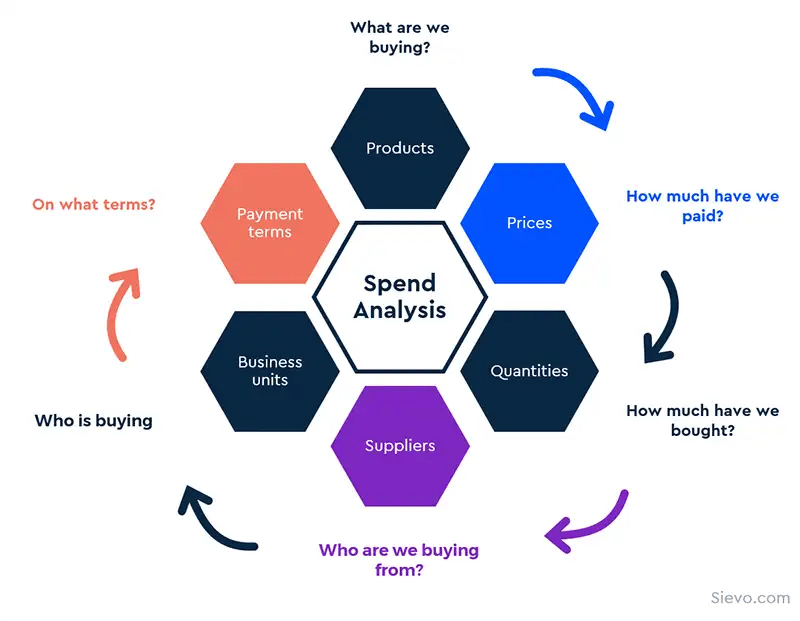
To sum up, spend analysis answers the what, who, and how of spending in your organization.
Key terms and definitions
Here are some basic definitions and key concepts to get started.
Spend data (also known as procurement spend data) is information dealing with a company’s expenditures on goods and services purchased from external suppliers.
Spend data management is the process of collecting, sorting, and managing that spend data.
Spend analytics is the process of collecting, cleansing, classifying, and analyzing spend data through either dedicated software or one-off spend cubes.
Spend analysis is the practice of analyzing spend data to decrease costs, increase efficiency, or improve supplier relationships.
FYI: Spend analytics and spend analysis are sometimes used interchangeably, but they are not the same thing. Without spend analytics, you won’t have the relevant information you need to do spend analysis.
You can think about it like this: spend analytics gets you the information you need, and spend analysis is what you do with it.
Spend analysis benefits
Spend analysis offers procurement organizations several key benefits.
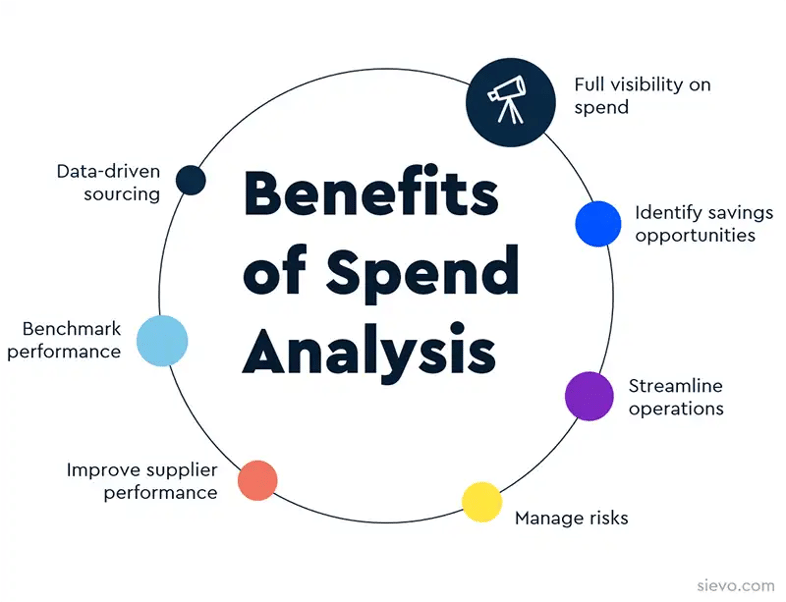
Here's an overview of some of the top benefits of spend analysis:
Full visibility on spend
The key benefit that spend analysis can provide to an organization is better visibility and actionable spend intelligence. It gives you a comprehensive view of the metrics that drive improved cost savings, process efficiency, and supply-chain performance.
Spend visibility goes beyond tracking spending, as it gives both a detailed and holistic picture of how money is moving through your company. Having spend visibility allows for analyzing past spend which can be utilized for planning future direction.
Identify savings opportunities
Spend analysis helps you meet your cost reduction goals and also follow up on incremental savings initiatives. Improved visibility helps identify cost-saving opportunities by reducing wasteful and maverick spending. You can benchmark your suppliers and their contract terms.
Streamline operations
Spend analysis contributes to cost-effectiveness and process efficiency in a lot of organizations. There will be a significant reduction in cycle time for creating reports and ad-hoc analyses, reducing labor costs and freeing up time for more productive work.
Manage risks
Good spend analysis data will also allow you to track and identify suppliers who have non-contracted spend and spend with non-contracted vendors. When your spend data is enriched with suppliers’ credit scores and other revenue information, you can better assess your organization's overall supply chain failure risk.
Improve supplier performance
Once the organization determines which suppliers offer the best value, it can work with them to establish more evolved procurement processes and inventory programs. Procurement professionals can peer into the performance of their suppliers to encourage proactive supplier development. At the same time, they can root out non-performing suppliers and help boost contract compliance by monitoring pricing on a continuous basis.
Benchmark performance
Spend analysis gives you the opportunity to benchmark your performance internally across business units in different locations. This paves the way for meaningful comparisons that can be used for strategic decision-making.
Data-driven sourcing
Spend analytics enables sourcing professionals to identify trends, market changes, performance issues, consolidation opportunities, and sourcing potential. It can be used to identify sourcing categories, segment suppliers, and narrow down critical suppliers for development programs.
How to do Spend Analysis
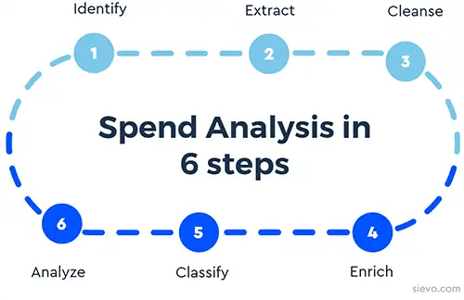
While spend analysis projects vary in shape and size, they typically include six key steps from spend identification to analysis.
1. Identify Data Sources
The first step is to get an overview of what spend will be covered. Doing this allows you to restrict those purchases to just a few key sources.
You can segment your spend into different groups and, from there, determine all the spend data sources available from your departments, plants, and business units. Start by identifying the areas of your business that make significant purchases, such as procurement, finance, and marketing.
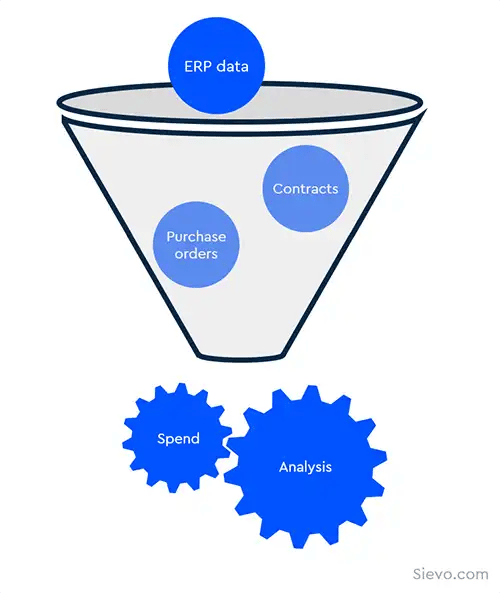
Here are some of the most common sources of procurement spend data.
-
enterprise resource planning (ERP) tools
-
general ledger information (i.e., an organization’s financial data)
-
purchase orders
-
data shared by suppliers
-
risk reviews
-
credit ratings
-
transaction data
-
other internal systems and external sources
2. Data Extraction
Once you have narrowed the scope down, you can capture your spend data and consolidate it into one central database. Data is usually in different formats, languages, and currencies, so collecting it into one source might be challenging.
3. Data Cleansing
Cleansing spend data detects inaccuracies and removes corrupt records and redundancies. This includes finding and eliminating errors and discrepancies in descriptions and transactions to ensure accuracy. Data cleansing lets you identify which contacts in your database are incomplete or irrelevant. Typos are removed, and missing codes are validated and corrected for up-to-date information.
4. Data Enrichment
Data enrichment refers to the process of enhancing, refining, and improving raw spend data. It also includes standardizing the spend data for easy viewing. Enriching the spend data makes sure that all the header and line-level names and details are accurate and to a specific naming standard.
5. Classification
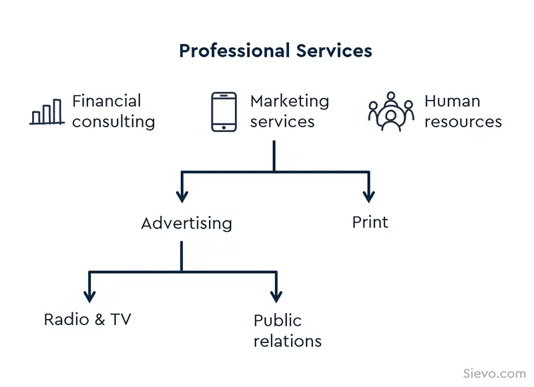
Classification typically involves grouping several suppliers of the same parent company or organization. Unifying heterogeneous spend data into clearly defined categories makes spend easier to address and manage across the whole organization. Classification is about harmonizing all purchasing transactions to a single taxonomy, enabling procurement to gain visibility of the global spending to make better sourcing decisions.
Both direct and indirect procurement spend can be grouped into categories, enabling analysis and management of similar goods or services.
A spend category is the logical grouping of similar expenditure items or services that have been clearly defined on an organizational level. For example, “information technology” may be considered a spend category covering both IT software and hardware.
The spend taxonomy is the way a procurement organization classifies spend into hierarchies. One way to view spend categories is like a tree with many branches for different levels or sub-categories of spend.
The number of levels in a spend taxonomy depends on the procurement organization’s needs, ranging from three to six levels of categories and sub-categories.
When designing a taxonomy it needs to be thoroughly communicated and aligned internally with key stakeholders such as Finance and local/global Category Managers. A clear definition and understanding of each subcategory in the taxonomy helps in classifying your data accurately.
There are also standard taxonomies such as the UNSPSC (United Nations Standard Products and Services Code), a common coding system describing goods and services. It may be used to categorize procurement spend, but these are often not ideal for strategic sourcing.
6. Analysis of Data
The last step is to identify opportunities for savings and other procurement improvements. Analysis can answer business problems like "What are the best contract deals per supplier?" or "Are buyers purchasing from preferred suppliers?"
You can identify opportunities for reducing the number of suppliers per category and negotiating better rates.
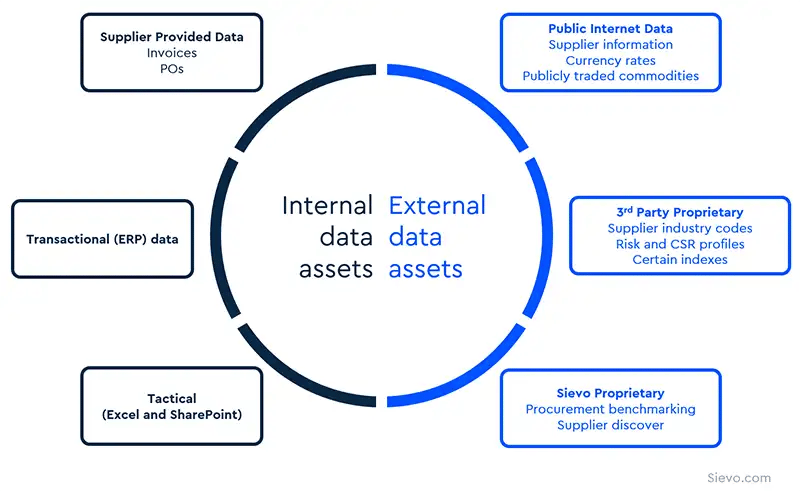
If you've come this far, it is beneficial to consider how external data assets can provide deeper and more strategic enrichment to your analysis. By connecting 3rd party data to your spend, you can make more strategic decisions powered by data.
This is especially relevant in sustainable procurement. connecting Carbon emission data to your spend can help reduce your Scope 3 emissions. Supplier sustainability scores can also form a part of your category analysis.
Spend Analysis KPIs and metrics
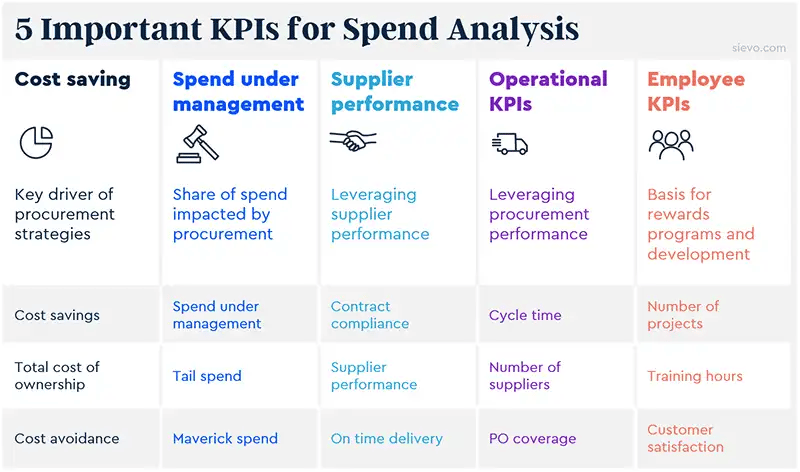
Procurement data can be sliced and diced based on a number of key performance indicators (KPIs), or metrics, relevant to the procurement organization. They exist to measure the effectiveness and performance of procurement management.
In addition, proper KPIs help you also to identify savings opportunities, manage supplier risk, and streamline procurement activities across business units.
Typical KPIs for procurement fall into these five groups:
-
Cost savings
-
Spend under management
-
Supplier performance
-
Operational KPIs
-
Employee related KPIs
Spend analytics solutions allow you to track KPIs in real-time through intuitive dashboards and custom reporting.
Spend Analysis Examples
There are countless opportunities and insights to discover in your spend data. Here are 6 of the most fundamental procurement analytics exercises you can use.
Spend Cube
The spend cube is a way to look at spend data projected as a multidimensional cube. The three dimensions of the spend cube are suppliers, corporate business units, and categories. The dimensions could include subcategories of the different units across the organization.
The spend cube is typically the final output of a spend analysis process. It allows you to look at all of the analyzed data from a variety of angles. A spend cube is usually needed if a company is not managing the full percentage of expenditures across all business units.
The 3 axes represent Category (What you are buying), Cost Center (Who you are buying it for), and Supplier (Who are you buying it from). These are the three legs of the stool – if any one leg is not there, the entire model falls apart.
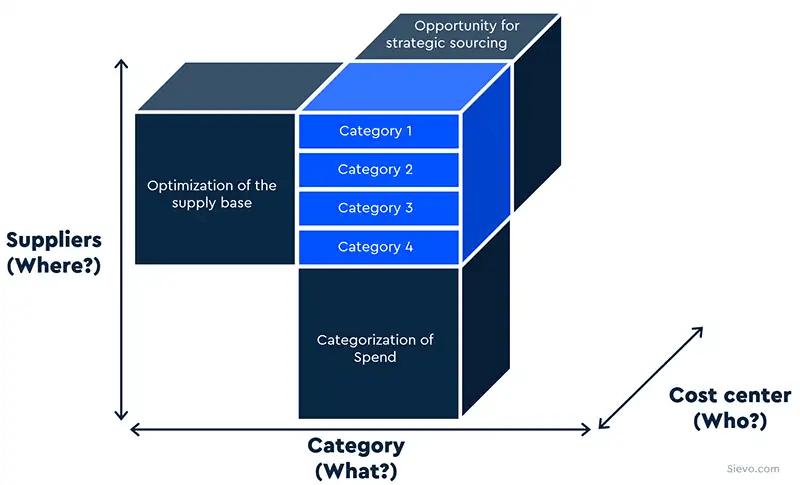
Each axis of this cube contributes critical information:
-
Category analysis tells what specific types of goods and services you buy.
-
Cost center analysis reveals which functions (or end-users) within your organization drive the demand.
-
Supplier analysis tells you which suppliers you’re buying from.
You can then assess if expenditures are scattered or cumulative, or if suppliers have simultaneous contracts with different units in the organization.
You can slice and dice data to analyze it from many different directions. This ensures that you have just one sourcing strategy and not hundreds. You can base your category strategies based on more insights.
Tail Spend Analysis
Tail spend is defined as the amount of money that an organization spends on purchases that make up approximately 80% of transactions but only 20% of total spend volume.
Tail spend is generally considered low-value purchasing, as it makes up only a small portion of spend (usually 10-20% of each spend category). Tail spend is easy to ignore but at a big cost. It is the place where procurement organizations may be leaving money on the table and utilizing their resources inefficiently.
With millions of purchases every year, companies can easily overlook small or infrequent spending. Procurement teams invest heavily in their core spend areas, but the tail-end remains a largely untapped opportunity for most companies.
There is little understanding of how much money is involved in tail spend, and even less knowledge of how to manage it. This can lead to potentially losing millions of dollars annually.
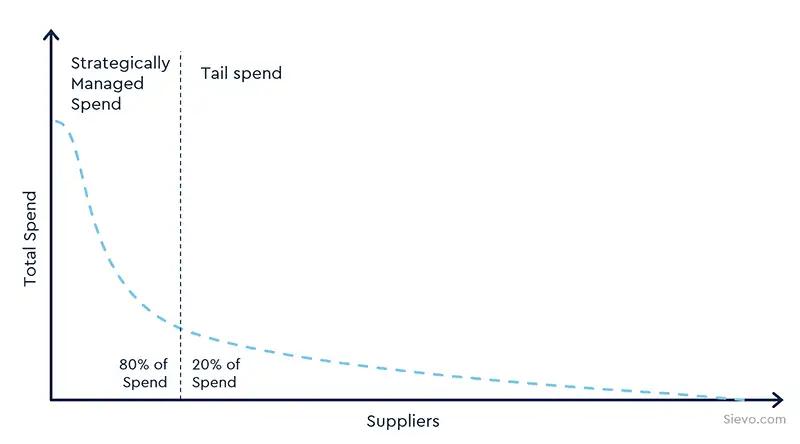
The figure above illustrates the simplest approach to analyzing a company’s tail spend: calculating the spend ratios to suppliers at various points along the purchasing range. Here, the Y-Axis represents spend per supplier ("Total Spend by Supplier"), and the X-Axis represents the total supplier base ("Supplier"), with suppliers ranked in descending order of size from left to right.
Tail-end spend management has been growing in recognition and increasing importance within procurement. Tasil spend analysis can yield potential savings, reduce costs, and increase spend under management.
Supplier Spend Analysis
Supplier spend analysis is the task of identifying the amount of spend coming from critical vendors. It involves creating a detailed spend profile for each vendor using historical consumption data. Knowing this can help focus efforts on getting the best value from these preferred vendors and consolidating the relationships.
Different types of vendor reports visualize spend insights in several ways: by vendor, by category, and by geography, for instance. Vendor reports enable year-on-year comparison and analysis for data-driven decisions. Spend can be optimized by identifying and implementing opportunities for consolidation.
There are usually many low-value transactions with multiple vendors across business units. The total number of one-off and small-value vendors can be high. To combat this, you can identify contract leakages and maverick spending. The aim is to reduce the number of vendors in each category.
Every dollar spent is important, and savings opportunities can be missed through off-contract purchases. Vendor spend analysis will facilitate the identification of purchasing trends and buying patterns and monitoring utilization and spend consolidation of key strategic suppliers.
Category Spend Analysis
Category spend analysis allows you to explore spend in a defined spend category hierarchy. This is useful in identifying spend leakage issues.
The first step in doing a category spend analysis is understanding the scope and breadth of the category. Are you buying similar goods and services from too many different vendors? This analysis is built on hierarchies, and the spend transactions are categorized into the most appropriate category.
Allocating spend consistently into categories makes the data easier to navigate, interpret, and understand. When organizations can focus on prioritizing their top spend categories, it helps them identify and forecast savings opportunities.
Prioritization will allow better negotiations for key spend categories to ensure more favorable contracts and pricing. By drilling into their spend data, procurement professionals are also gaining a deeper understanding of their spend categories.
When you have a high-level overview of spend by category, it is easier to identify categories that help deliver savings and realize which projects bring strategic importance to the organization. With this, you can easily figure out which action to take based on what has the most impact on staff or operations and what the risks associated are.
Access to detailed information on spend by category gives you the data to determine priorities and allocate resources to deliver the highest return on investment for the level of effort required.
Item Spend Analysis
Item spend analysis refers to analyzing expenditure at an item/ SKU level. It focuses on individual purchases by classifying each one of them to identify what department it was for and what supplier was used.
This analysis gives the ability to know whether a specific item is being purchased from various suppliers or in several locations and at different item prices. It can highlight the different opportunities for purchasing in the business. You may also identify spend leakage issues, such as purchasing from non-preferred vendors and maverick spend.
Payment Term Spend Analysis
Payment term spend analysis provides excellent insights for companies to analyze payment practices and terms within their purchase-to-pay (P2P) processes. It explores the opportunities of leveraging all possible discounts or interest from the invoice payment process while increasing working capital.
Suppliers may reward early payment of invoices with discounts, but early payment may also mean losing interest in working capital.
Payment term spend analysis utilizes data and gives a comprehensive view that enables you to identify unrealized discounts through late payments of invoices or opportunities to negotiate better payment terms to capture unrealized interest.
It also covers the review of payment patterns to identify practices and activities that are not done properly.
Contract Spend Analysis
Finally, contract spend analysis tells companies if they are complying with their existing negotiated contract terms.
It analyzes spending with vendors by contract to identify leakage through non-compliant contracts. It ensures that the best contract deals per supplier have been negotiated and that all buyers purchase from preferred suppliers.
Spend Analytics Reports
Now that we have covered all the basics, including what spend analysis is and how to do it, it's time to look at the outputs: spend analysis reports.
To get a good idea of how spend data visualization looks in action, here are numerous examples.
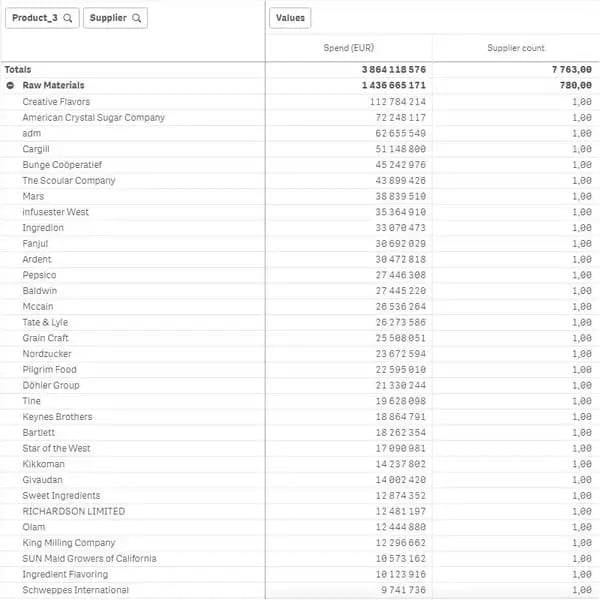
Pivot Table
Pivot tables are a convenient way to build intelligent, flexible summary tables. Unlike basic tables which only have rows and columns, pivot tables quickly summarize the information (e.g., totals, averages, count, etc.).
In the example below, a simple pivot table of supplier count by product category provides a good overview of where raw materials are being purchased.
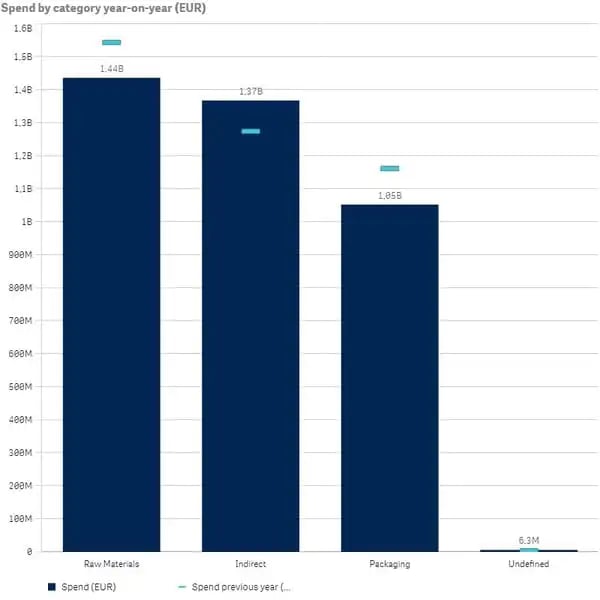
Bar chart
The most basic graphical report is a bar chart, which visually shows relative amounts of a numerical value. As a reporting metric, the small ticks are added on top of the bars to compare the spend to the previous year. This example shows the user spend by category compared to last year.
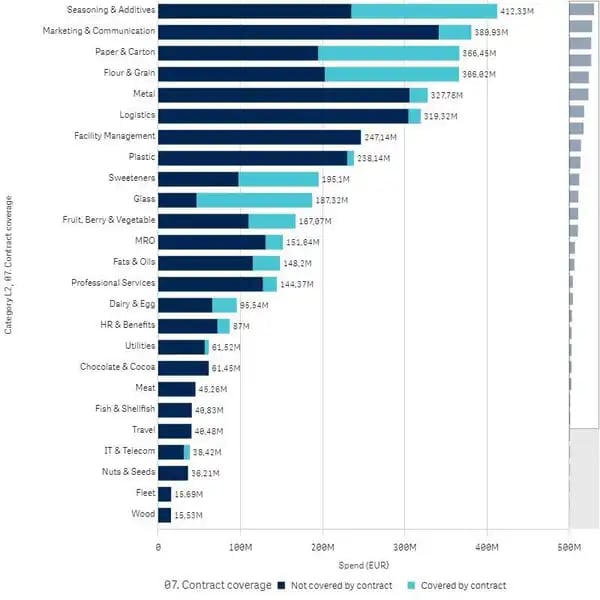
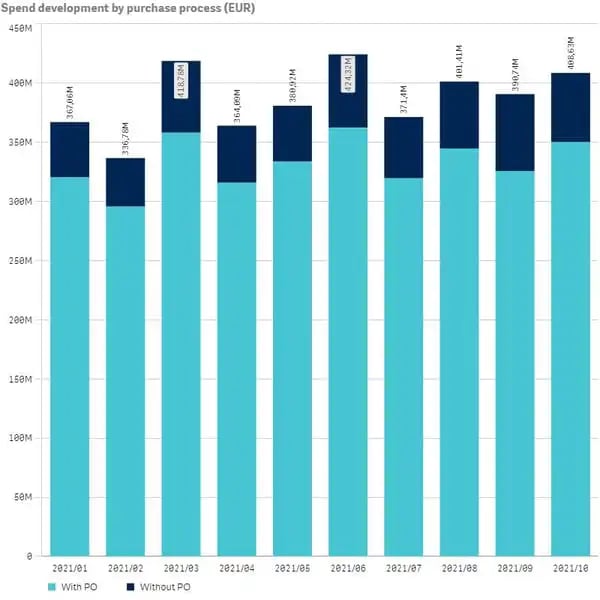
A stacked bar chart adds together multiple values, as in the example below. A stacked bar chart helps the user quickly see the relationship between spend development with PO and without PO.
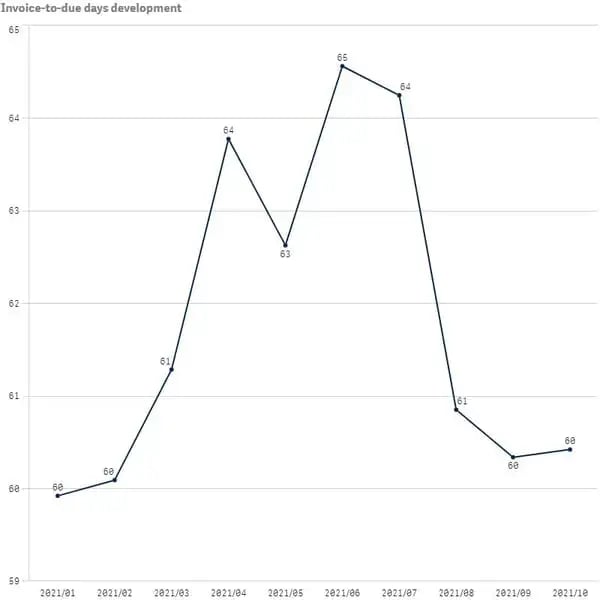
Line Graph
Line graphs are also simple but effective spend analysis reports. They are usually effective in representing change over time. For instance, the line graph below can tell the user at a glance that June has the highest invoice-to-due average.
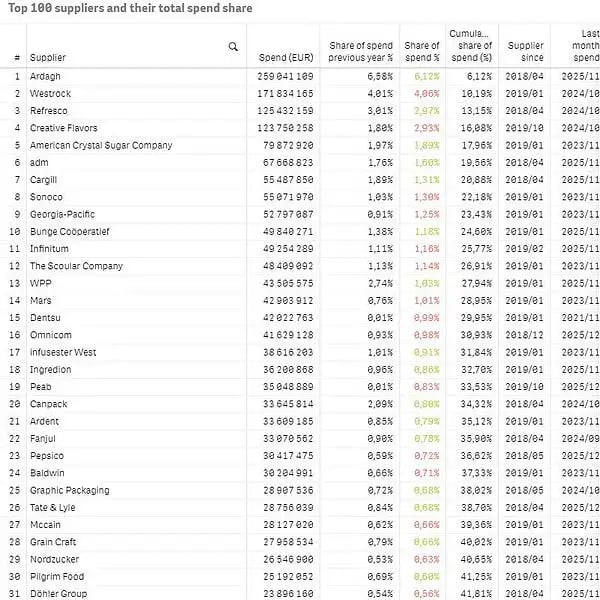
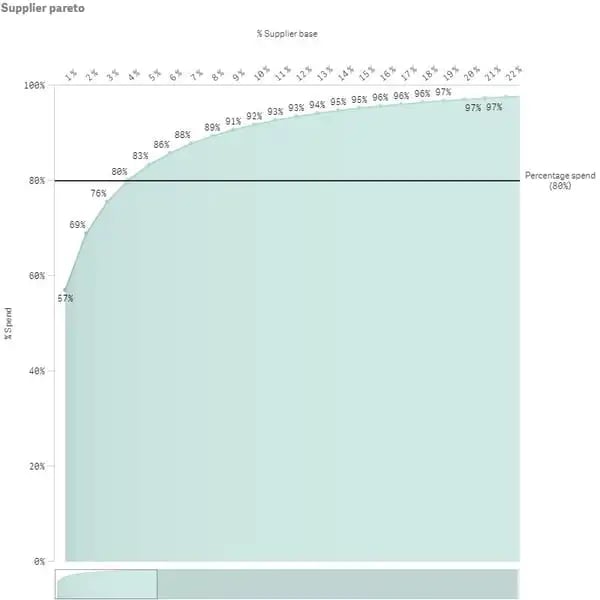
Pareto Chart
In spend analysis, Pareto charts are very useful in opportunity identification because they visually show the 80/20 rule: 80% of the spend is accounted for by the top 20% of suppliers (in the example below, it's closer to 3%!). Keeping an eye on this supplier Pareto chart can tell procurement how heavily they rely on their key suppliers.
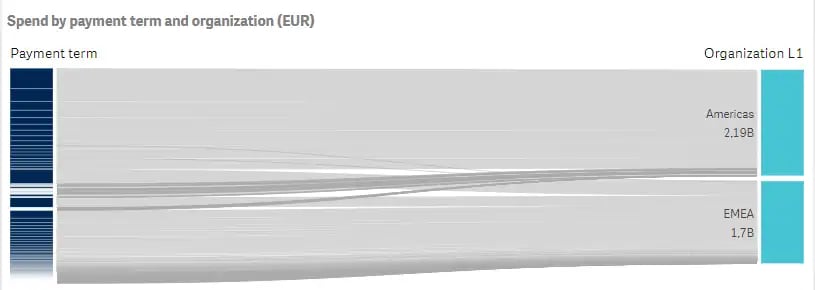
Sankey Diagram
A Sankey diagram is an at-a-glance representation of categorical breakdowns. The thickness of the lines changes as categories merge. Starting on the left at the thinnest level, the subcategories converge and form a larger category. In the example below, you can see the split of payment terms between the two organizational regions.
*By the way, in your spend analysis software, you can also view and zoom in on each thin line to see what's going on.
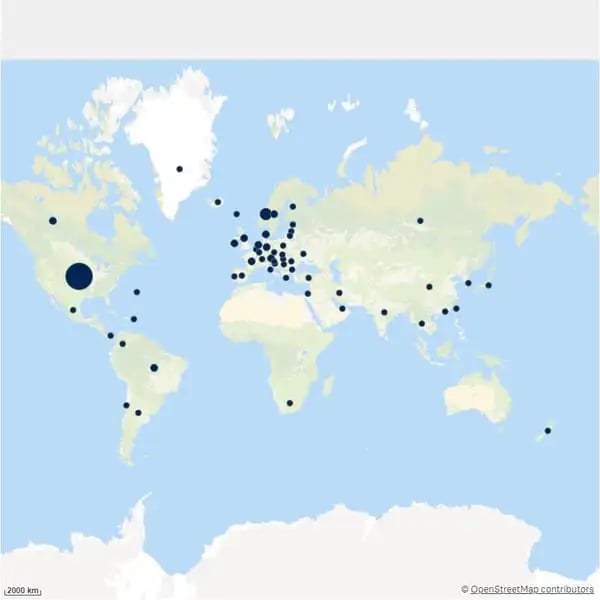
Map report
A map report is a chart type that shows spend on a geographical map. Map reports are usually interactive, so clicking on a particular country or geography will open a specific chart for the user to further drill.
Map reports show hotpots and can be used to determine any type of country or region-based factors.
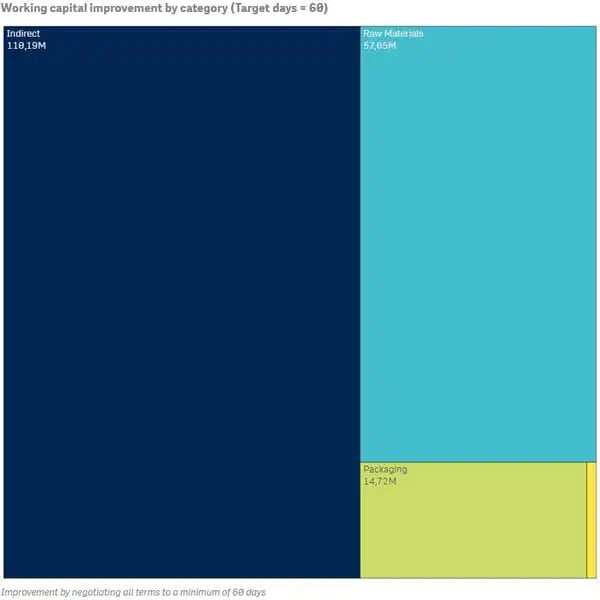
Treemap report
Treemapping is a method of visualizing hierarchical data with proportionally sized squares. For spend analysis, this plot shows relative spending by the size of a block.
Treemaps can be very sophisticated and interactive. They are also very powerful for visualizing the relative spend across a single dimension, such as commodity, suppliers, etc.
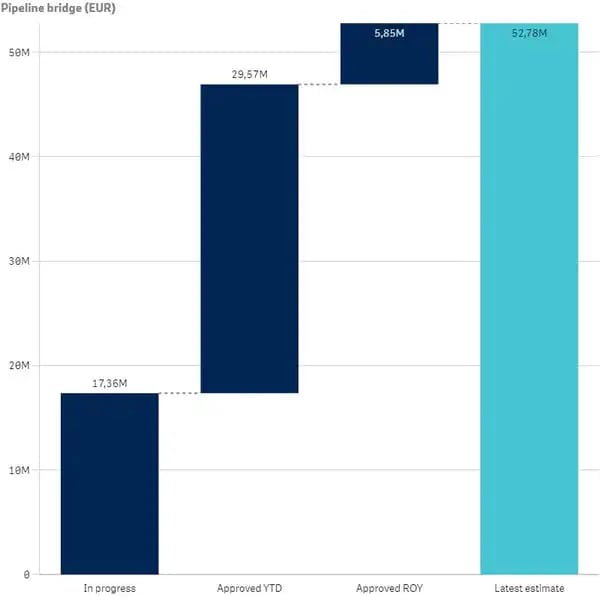
Waterfall Chart
Finally, the waterfall chart is used to show the cumulative effects of positive and negative values. This type of chart is commonly referred to as a "bridge" in finance.
In Sievo, we've created a special chart for finance and procurement use called the SavingsBridge. In a nutshell, we take the data and split the spend change into components. As a result, you have a complete view of your procurement savings and the contribution that procurement has made to improve the company’s bottom line.
Spend Analytics Dashboards
A dashboard in the software context is referred to as a user interface or view that captures and presents a holistic view of information about a series of predefined topics.
A spend analytics dashboard is a dashboard that visualizes sets of spend data into charts for the purpose of analysis. These sets of data are selected based on predefined parameters, business targets, or KPIs.
The benefit of a dashboard is an instant high-level picture of spend data. In this chapter, we will cover 9 basic types of spend analysis dashboards used in Sievo.
Learn more about Sievo Spend Analytics
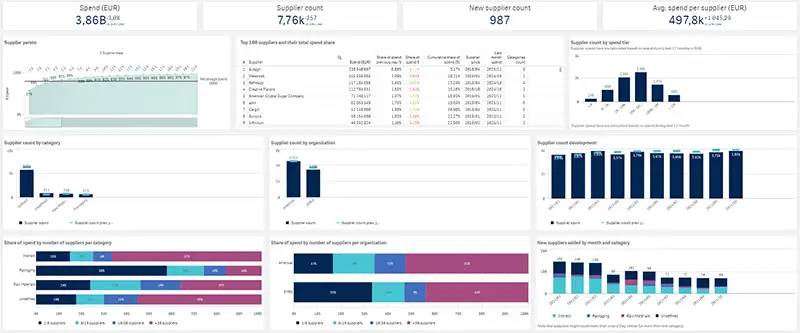
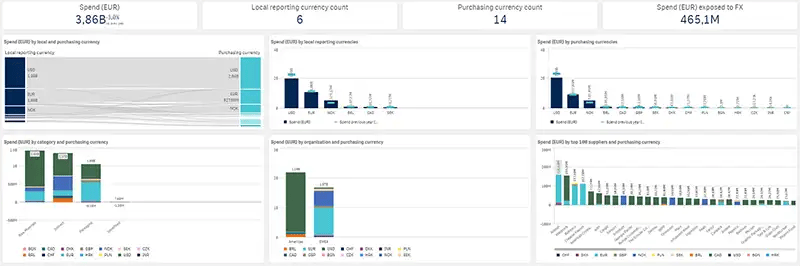
Spend overview dashboard
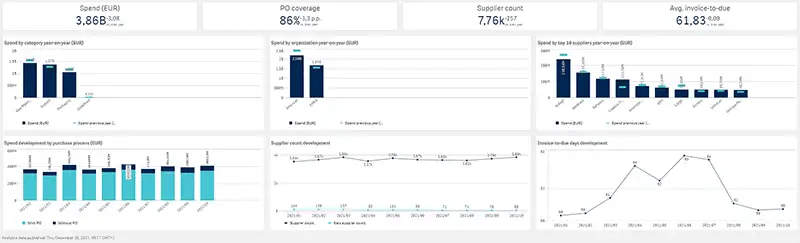
Example of Sievo's Spend Overview Dashboard
A Spend Overview Dashboard provides an overview of your spend performance by comparing data of one selected period to the previous one. In the example above, this view is filtered by year-to-date and presents the data by three key aspects: category, organization, and supplier.
It shows multiple charts that visualize different sets of spend data. You can see in this example the distribution of spend by categories (raw materials, indirect, packaging, and undefined), distribution by organization (Americas and EMEA) as well as the distribution of spend by top 10 suppliers.
With a dashboard like this, you can track the top suppliers by region, spend changes by category, purchase process developments, as well as supplier count developments.
A proper spend analytics dashboard should be interactive, meaning you can select and filter data directly on the charts. Depending on what your responsibilities are, you can use a spend analytics dashboard to gain insights to questions or goals in mind with just one click.
Let’s say you are interested in your spend performance in Americas. You simply select Americas in the organization chart and the view automatically filters the data by Americas. Now you see a more defined view of the dashboard covering charts that visualize spend data that was classified to the specific organization level.
Below, you can see an example of the same Spend Performance Dashboard filtered by the Americas region with one click.
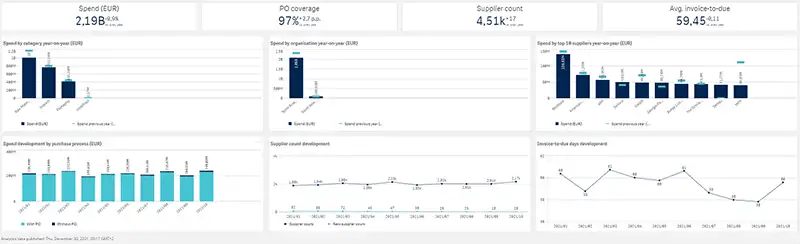
Example of Sievo’s Spend Overview Dashboard after filtering by organization Americas
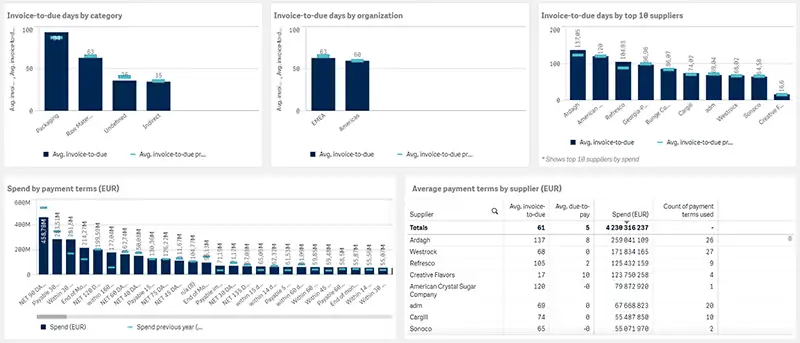
Supplier Performance Dashboard
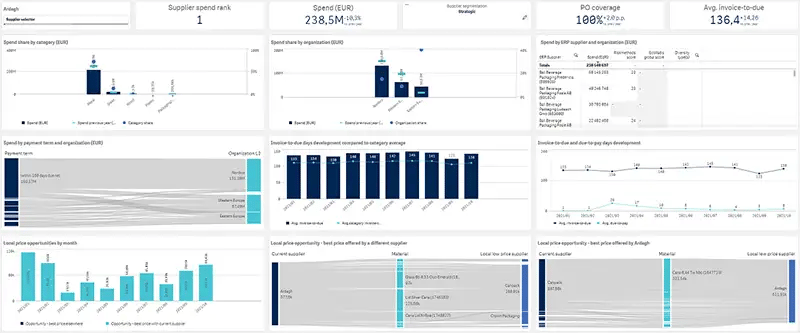
Example of Sievo’s Supplier 360° Dashboard
A Supplier Performance Dashboard visualizes all relevant data of a specified supplier, giving you a 360-degree perspective. In this example, you can see relevant analytics on the top supplier by spend ranking.
This provides transparency to what you are purchasing from a specific supplier as well as the relevant payment terms across business units. By having an overview of supplier spend data, you are also able to compare a supplier against its peers, gaining insights into performance opportunities.
A Supplier Performance Dashboard is useful in, for example, strategizing supplier meetings to re-negotiating payment terms or ensuring compliance for better payment terms across all your business units.
Category Performance Dashboard
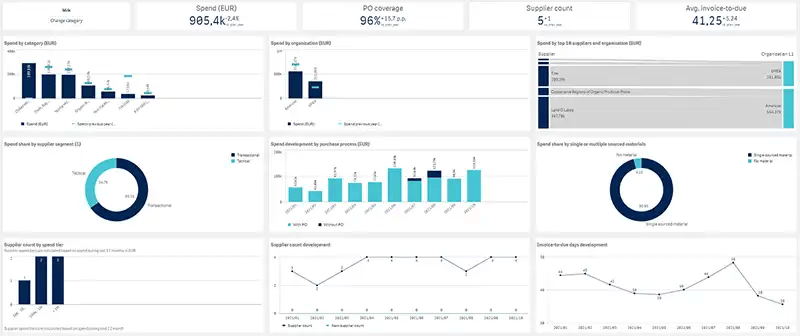
Example of Sievo’s Category 360° Dashboard
The Category Performance Dashboard is similar to the Supplier Performance Dashboard, but instead of a specified supplier, it shows all relevant data of a selected category. With the Category Performance Dashboard, you can analyze the spend distribution throughout your categories, keep track of purchase order development, material price development, and see which suppliers your business units are sourcing from.
The Category Performance Dashboard is especially useful in providing category management insights. You can identify price opportunities or find materials sourced from a single supplier which may result in a business risk such as a single point of failure. On top of that, you can track how much was purchased with or without a PO and assess purchase price development by drilling down to the lowest category level.
Supplier Base Performance Dashboard
Example of Sievo’s Supplier Tail Dashboard
A Supplier Base Performance Dashboard gives you the ability to analyze data from the whole supplier base. You can keep track of your top suppliers and identify tail-spend suppliers, giving you transparency on consolidation opportunities and helping you tackle the tail spend to mitigate risks or create savings.
The Supplier Base Performance Dashboard is great for when you want to do a tail spend analysis but can also be used for internal benchmarking purposes. You do this by looking at how fragmented or consolidated your supplier base is in different business units in a single category.
Sourcing Performance Dashboard
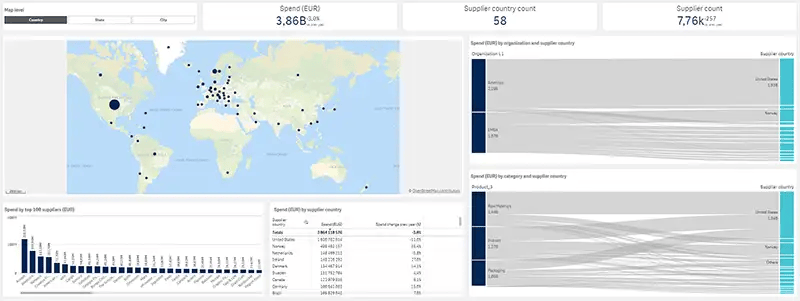
Example of Sievo’s Sourcing Geography Dashboard
With a Sourcing Performance Dashboard you can immediately see from which regions your business units are sourcing. You can also gain transparency into which materials are sourced internationally vs domestically and evaluate potential regional risks. All this helps you assess and anticipate the impact of trade or geopolitical turmoil.
A Sourcing Performance Dashboard is useful in managing regional risks as well as identifying where certain goods or services are coming from. You can for example identify savings in logistics costs from imported goods by switching to suppliers that are geographically closer.
Process Performance Dashboard
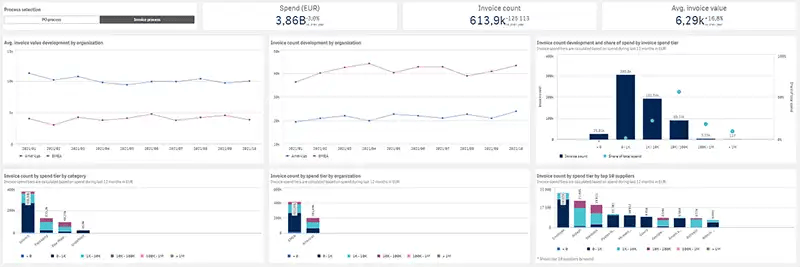
Example of Sievo’s Process Optimization Dashboard
A Process Performance Dashboard shows the areas of possible improvement on small POs/invoices. This refers to the costs involved in processing transactions. By finding suppliers with small value POs/invoices, you can potentially gain savings.
It also allows you to see any category differences in terms of the quantity and amount of invoices/POs expected. When filtering by a specific category, discrepancies between business units or suppliers can be identified and assessed for strategic process optimization.
A Process Performance Dashboard is useful when you want to analyze invoice and PO counts development, do an internal benchmark on average invoice/PO values between different business units as well as find suppliers with small value POs/invoices. These performance insights help you identify opportunities in streamlining your purchase process.
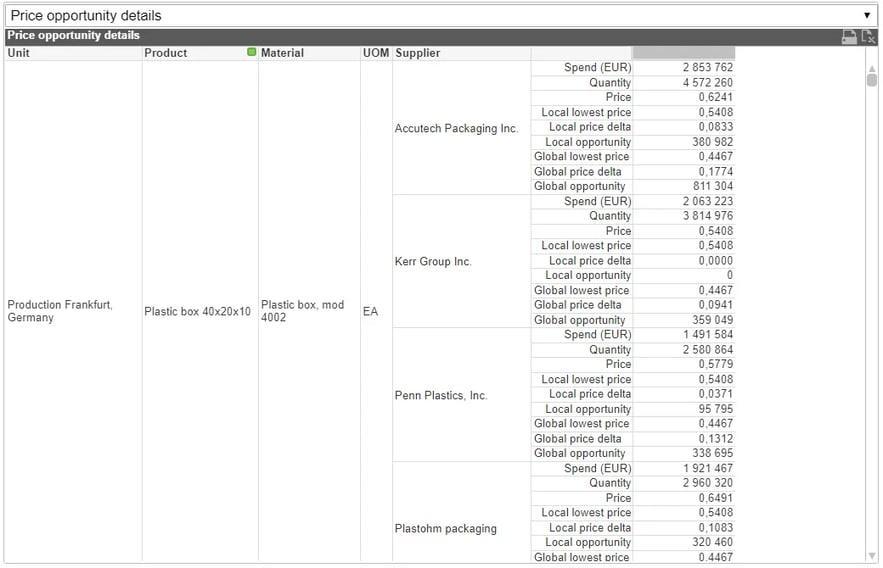
Price Performance Dashboard
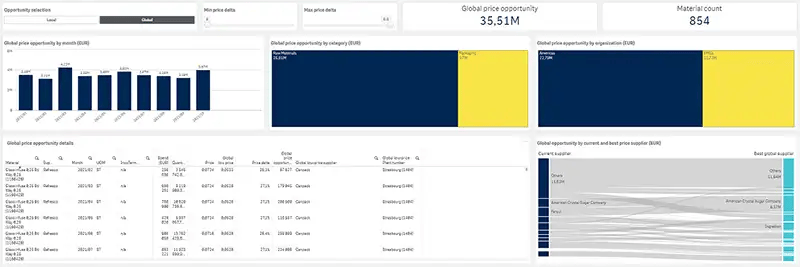
Example of Sievo’s Price Opportunities Dashboard
A Price Performance Dashboard helps you analyze price discrepancies between different suppliers. When filtering by a specified region, category, and supplier, you can determine price opportunities. A Price Performance Dashboard allows you to identify such price opportunities globally as well as regionally, helping you to discover the price range of your specified category.
The price opportunities presented in a Price Performance Dashboard are useful when you are negotiating for cheaper prices or want to find the cheapest suppliers in a category.
Currency Performance Dashboard
Example of Sievo’s Currency Portfolio Dashboard
A Currency Performance Dashboard gives a proper overview of spend distribution in different currencies and helps you recognize which categories or suppliers are purchased using different currencies. You gain transparency on risks associated with different currency purchases such as foreign exchange risks.
A Currency Performance Dashboard is useful when you filter by a specified category or supplier, as this helps you to determine materials or suppliers that could get more expensive when the purchasing currency would strengthen in relation to the local currency.
Custom Dashboards
This chapter has reviewed just some of the basic spend analytics dashboards. The ready-made charts in the above-mentioned dashboards can give you a great overview with only one click. But what if you cannot find one matching your goal in mind?
What you will need is a Custom Dashboard, where you can mix and match any dimension, measure, and chart type for any report you need and slice and dice with any data point you want. This is especially useful for your presentations.
The image below shows how Sievo's Self Service Dashboard allows you to build reports to meet your specific needs.
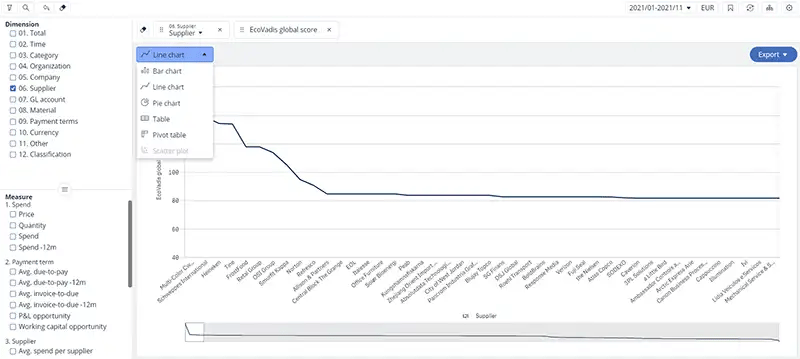
Example of Sievo’s Self Service Dashboard
Spend Analysis Tools
There are many tools available for analyzing procurement spend ranging from simple Excel Spreadsheets to advanced analytics software.
Here you can find the pros and cons of each alternative.
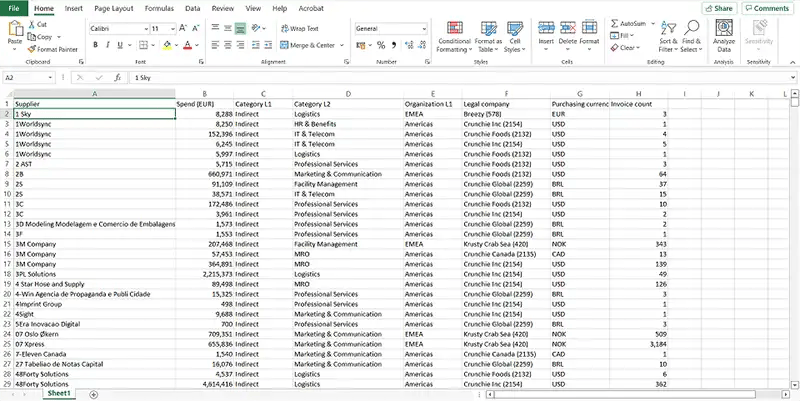
Spend Analysis in Excel
Microsoft Excel, though it’s been on the market for over 30 years, is still an excellent tool for making powerful dashboards that can provide analysis and deliver insights in a timely manner.
A lot of people use Excel to analyze spend data but fail to do so in the most effective and efficient way. The spend data that is categorized by the supplier or by name is usually found as raw data.
When this data is in an Excel spreadsheet, it provides a company with an overview of its spend structure and helps it understand which part of supply chain needs to be prioritized.
While doing spend analysis on Excel is doable, most organizations will still encounter issues. For example, Excel is not scalable for spend data in the hundreds and thousands of rows.
Challenges like over-generalized classification, data inconsistencies and data formatting issues, same supplier different names, and regional settings causing inconsistency will cause a normal analyst to do more data cleaning work than actual data analysis.
Even if you’ve been able to do all this properly, it can take hours or even days of work, and you will then need to update and classify new data each month, which will not be scalable. There are solutions in the market that have developed technology for just this and provide their service as a cloud solution.
Spend analysis processes run on Excel and Access-based tools don’t benefit from the repeatable process that spend analysis automation enables. Manual processes lack timeliness and speed of data updates and refreshes, as well as present the risk of limited reporting and analysis capabilities.
Without the ‘slice-and-dice’ ability of many spend analysis systems (the ability to cut spend data in a myriad of ways for efficient analysis), the reporting process of the spend analysis function is limited.
Pros and Cons of using Excel in Spend Analysis
| Pros | Cons |
|
Spreadsheets are within procurement’s comfort zone. They’re inexpensive and work with templates and formulas to aggregate data. |
Spreadsheets are time-consuming and users spend a significant amount of time collecting spend data. |
|
Spreadsheets are good for documenting and reporting very simple stand-alone requirements. |
They become exponentially difficult to manage when multiple compliance sets and multiple locations are involved. |
|
It is easy to create data collection tools and simple to create charts. |
Spreadsheets are not designed to record an audit trail of accountability and struggle to assign owners to processes. |
|
No need to extract data from external systems, all data is right at your fingertips. |
They do not deliver automated workflow-driven processes and require manual intervention to deliver reports that are more prone to error. |
|
Using Excel, reporting is usually easier and more hassle-free. |
This is not a secure process due to people using email to send updates and creating different versions of the spreadsheet. |
Spend Analysis with BI Tools
Business Intelligence (BI) tools are a type of application software used to collect, structure, and visualize large amounts of data. While BI is broadly used for many business purposes, they are a little less flexible than analytics software.
Using business intelligence (BI) tools for spend analysis enables companies to have a better understanding of their costs, which makes it easier to align expenditures with revenue.
Let's look at three good choices for BI tools: Microsoft Power BI, Tableau, and QlikView.
Microsoft Power BI
Power BI is a suite of business analytics tools used to analyze data and share insights. It is a cloud-based data analysis platform that can be used for reporting and data analysis from a wide range of data sources.
Power BI dashboards provide a 360-degree view for business users providing them the ability to see all of the most important metrics in real-time, and usually on different kinds of devices. Users can examine the data behind the dashboards with just one click. The intuitive tools help make finding answers easier. The pre-built dashboards and hundreds of connections to known business applications make doing analysis simple and quick.
Power BI, with all its portals and applications, can unify all of your organization’s data. With better data management and access, companies can get the visibility and insight they need to improve procurement performance.
These are some areas of spend that can be addressed:
-
Materials (volumes and prices included) that the procurement organization purchased during this period and if there are any changes within a specific period of time
-
The number of vendors whom the company has purchased from during a particular year and the amount of money spent per vendor in a given time
-
The number of transactions done in several stages of the procurement cycle
-
The number of requisitions, contracts, and purchase orders processed across the organization by the buyer and the average value of each transaction
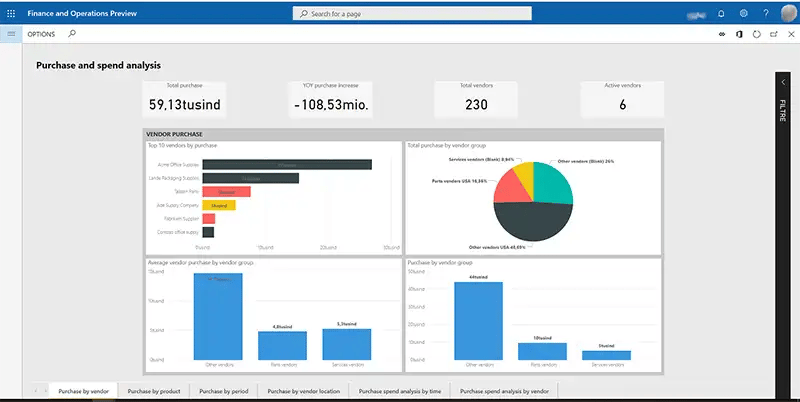
Image source: doc.Microsoft.com
Tableau
Tableau is an industry-leading business intelligence tool that focuses on data visualization, dashboards, and data discovery. As a leader in the Gartner Magic Quadrant for the past 11 years, it is an interactive tool that provides a side-by-side analysis of spend data with tons of visualization possibilities.
It is very simple for non-technical people to easily create customized dashboards that provide insights that can be used for company strategies. With its easy user-friendly interface, drill-down capabilities, and intuitive way of working with data, it transforms the way people use data to solve problems. It also comes with real-time data analytics capabilities and cloud support.
Tableau provides information easily on relevant questions like who the most profitable customers are, what they buy, and how much is spent in different categories. You can look at sales by region, segment, category, and year with just a few clicks and hover over data to see the details instantly. Having easily understandable dashboards paves the way to more data-driven decisions.
Also, Tableau Public offers free user-generated templates to visualize your data, like the one shown below.
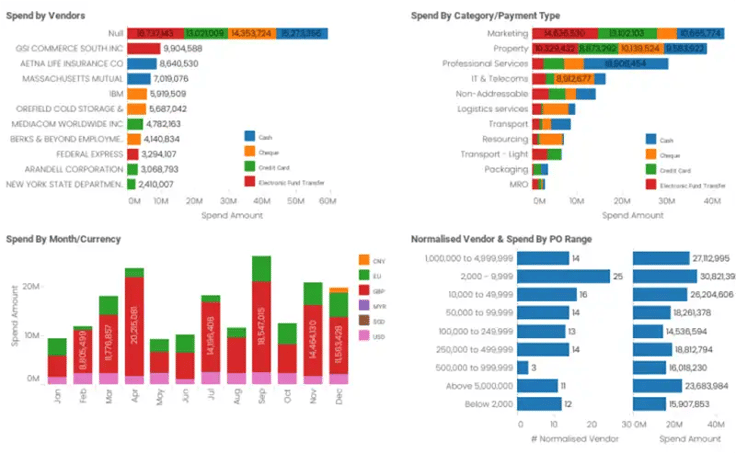
Image Source: Pulic.Tableau.com
QlikView
QlikView is a Business Intelligence (BI) tool that enables a user to create reports and dashboards for any use case. It is commonly used by business users who consider the power of modeling the data as well as data preparation before doing the analysis and visualizations/dashboards as a key differentiator.
On top of that, Qlik and its patented associative technology allow a user to unearth relationships within the various data sources. It also encapsulates the data into compressed memory for faster analytics vs. other providers who mainly rely on direct connections to data sources.
Because it offers guided and collaborative analytics, even non-professional users without IT skills can build and deploy analytics apps easily and quickly. This results in a faster response to changing business requirements and driving more insights across the organization.
A flexible platform, the QlikView consolidates data from multiple sources to provide centralized data for high-level reporting. The intuitive click-through dashboards makes it easy for users to understand hidden trends and gather insights from them.
With QlikView, possibilities are endless for making ad hoc queries because it does not require tedious defined structures and hierarchies. Effective and accurate decisions are made faster with the right and easily accessible information available.
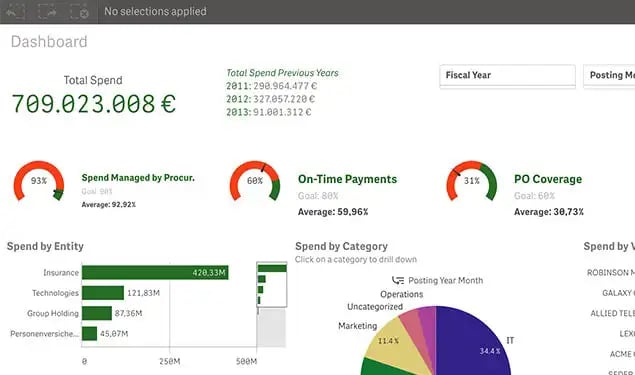
Image Source: Qlik.com
Pros and Cons of BI Tools in Spend Analysis
| Pros | Cons |
|
Data visualization is easier, quicker, and nicer
|
Data security is questionable
|
|
The ability to manage big data in real-time
|
People can make different conclusions from the same data
|
|
People can go ‘hands-on’ with the data
|
There might be a need for multiple BI applications
|
|
More possibilities for customization
|
More expensive than lightweight tools like Excel
|
|
Many solutions are available that can let you operate at a scale that is right for your organization
|
|
|
The platforms usually give content developers and line-of-business analysts a more rapid approach to defining, executing, and saving queries
|
Spend Analysis Software
Spend analysis software provides a consolidated view of procurement spend including data from invoices, purchase orders, and other business financial records.
Spend data may be collected from a number of different sources such as enterprise resource planning systems (ERPs), purchase-to-pay suites, or even shared Excel reports.
Compared to the other spend analysis tools mentioned (Excel and BI), spend analysis software is the most robust tool for performing this type of analysis.
Sievo Spend Analytics ranked as a top business value enabler by SpendMatters!
Spend Analysis Software Types
Spend analysis software is either bought from a specialized software vendor or created specifically for the needs of a procurement organization.
-
In-house solution – a custom software solution that is created for the procurement organization, either on top of an existing business intelligence solution or as a dedicated piece of software. Maintenance and upgrades are dependent on the organization’s information technology resources.
-
Licensed software – Software that is sold as a commodity, where a single-use license allows for the installation of the software for a set amount of machines. Depending on the updated agreement, larger updates might require a new purchase of a license. Most of the time, licenses are sold as a lump-sum purchase.
-
Software as a service (SaaS) – Software that is sold as a subscription and is delivered flexibly. Often the software is hosted in a separate location, allowing for centralized management by the provider. Updates are carried out as part of the software subscription agreement.
About Sievo
We are the procurement analytics solution for data-driven enterprises.
We give procurement, finance, and leadership teams a single source of truth and radical transparency in all sourcing decisions. Our solution helps you choose the right suppliers, deliver savings and manage compliance with confidence. Not only that, we enable a sustainable, diverse, and resilient supply base.
We master the art of extracting, classifying, and enriching data across all ERPs, procurement systems, and external data sources, saving your valuable time.
Simply put, we’re pretty damn good at turning even the crappiest data into actionable insights!
We’ve pushed the boundaries of spend analytics for two decades – and we’re just getting started. We bridge the data-to-action gap and power agile procurement by combining AI with procurement expertise.
Procurement organizations need an analytics partner they can trust. We’re large enough to deliver, small enough to care
The #1 Spend Analysis guide
Delve deeper into best practices for spend analysis, why projects fail, and extra content.